


Home Blog Page 26

US Immigration Policy: Key Changes & Impact

0
US Immigration Policy: Key Changes & Impact

As the United States moves forward with a new administration, immigration policy continues to sit at the center of political debate, with clear signals around stepped-up enforcement, revised visa procedures, and tighter border controls. From my years analyzing these systems, the real test lies in how executive directives translate into operational capacity at agencies like CBP and USCIS rather than the announcements themselves.

Border encounter figures from U.S. Customs and Border Protection show a clear downward trend after peaking in 2023. Southwest border totals fell from 2,472,513 encounters in 2023 to 1,847,183 in 2024, with the first quarter of 2025 running at an annualized pace near 1.84 million. Apprehensions dropped to 843,156 last year while inadmissible determinations stood at 1,004,027. The data behind this claim is actually more nuanced than reported, because the decline coincides with expanded Mexican and Guatemalan enforcement cooperation; without those bilateral arrangements the numbers would likely have remained elevated even after domestic policy shifts.

Understanding the mechanics of border enforcement reveals why these partnerships matter so significantly. The U.S. Customs and Border Protection agency operates under resource constraints that limit processing capacity at ports of entry, and the agency has faced chronic staffing challenges that restrict the total number of agents available for patrolling and processing. Mexico’s decision to deploy National Guard forces along its northern border and Guatemala’s expanded immigration enforcement have created a first-line filtering effect, preventing many potential migrants from even reaching U.S. entry points. This multilateral approach distributes the enforcement burden across the region rather than concentrating pressure solely on American ports of entry, which would require substantially increased Congressional appropriations to handle surge capacity.

The visa system itself rests on a series of capped and uncapped categories whose processing timelines and eligibility rules directly shape legal inflows. H-1B specialty occupation visas carry an annual cap of 65,000 plus 20,000 for advanced-degree holders, with typical adjudication running four to six months. F-1 student visas have no numerical limit and process in two to four weeks once school acceptance and financial documentation are verified. EB-5 investor visas require a minimum $1.05 million outlay and face 18-to-36-month waits under the current 10,000 cap. Family-sponsored immediate-relative visas remain uncapped but still require six to twelve months for relationship and sponsor verification. The Diversity Visa lottery allocates 55,000 slots annually with two-to-four-month processing windows tied to education or work criteria.

One often-overlooked dimension of visa policy involves the “visa bulletin” system maintained by the State Department, which tracks priority dates and application progress through the National Visa Center. For employment-based categories, the visa bulletin determines whether applications are “current” or face processing delays, directly affecting when foreign nationals can adjust status or consular process their applications. The current backlog in EB-3 (skilled worker) and EB-4 (special immigrant) categories stretches back several years, meaning applicants approved by USCIS still face years of waiting for an actual visa number to become available. This structural bottleneck exists independent of border enforcement or visa cap policy, yet it shapes the real-world timeline for many employment-sponsored immigrants.

As someone who worked in policy analysis, the mechanism behind E-Verify expansion is straightforward yet administratively heavy: the joint DHS-SSA electronic system cross-checks I-9 data against federal databases, and the latest rules now mandate participation for construction, hospitality, agriculture, and food-processing employers within ten days of hire. Roughly 24 million verifications occur each year at a 99.7 percent accuracy rate, yet 43 percent of U.S. employers still sit outside the system. The expansion is projected to pull in another 5 to 8 million hires annually, with penalties ranging from $250 to $2,000 per violation for non-compliance.

The practical implications of E-Verify mandates deserve closer examination, particularly for industries already facing labor shortages. Agriculture depends on seasonal workers, and mandatory E-Verify verification creates timing complications during harvest periods when employers need rapid hiring decisions. Construction firms working on fixed timelines face potential project delays if unexpected verification issues arise. Hospitality employers in tight labor markets report that verification requirements sometimes deter applicants from completing the hiring process altogether, shifting worker competition toward states or sectors without mandates. Moreover, the system’s 99.7 percent accuracy rate still produces false positives affecting thousands of workers annually—U.S. citizens and authorized immigrants who face employment termination during the mandatory secondary verification process that can take weeks to resolve.

Asylum procedures have shifted toward pre-arrival digital filing through the CBP One mobile application, allowing applicants outside the country to submit biographical details, photos, and schedule port-of-entry appointments. Additional elements include intensified background screening, adjusted credible-fear interview scheduling, faster expedited-removal tracks for ineligible claims, and new regional processing centers in third countries. The Executive Office for Immigration Review backlog reached 3.1 million cases by January 2025, up from 1.6 million in 2020, with average hearing waits exceeding four years in many jurisdictions.

The CBP One application system represents a significant procedural shift that fundamentally changes how asylum seekers interact with the immigration system. By requiring applications before arrival, the system theoretically creates orderly scheduling and allows biometric collection before an applicant reaches the border. However, access barriers prove substantial: the app requires internet connectivity, a smartphone, and literacy in the user interface. Applicants in remote areas or displaced camps may lack reliable data access, effectively excluding them from the orderly scheduling process and channeling them toward illegal border crossings instead. Research on the system’s equity impacts remains limited, but preliminary evidence suggests that wealthier or more tech-literate migrants gain preferential access to appointments, while vulnerable populations face extended delays in dangerous conditions.

Economic analyses from the Congressional Research Service and National Academies of Sciences document immigration’s labor-force and fiscal footprint. Immigrants make up 17.8 percent of the 2024 U.S. labor force, launch businesses at an 80 percent higher rate than native-born citizens (generating roughly 920,000 jobs yearly), and pay an estimated $600 billion in combined federal, state, and local taxes. Their contribution to annual GDP growth sits near 1.5 percentage points, though long-term net fiscal effects remain sensitive to educational attainment, with college-educated cohorts delivering the clearest positive returns.

Beyond aggregate statistics, immigrant entrepreneurship concentrates in specific sectors that shape regional economic development. Immigrants now represent over 40 percent of founders in the biotechnology and pharmaceutical sectors, and roughly one-third of healthcare practitioners hold immigrant backgrounds. In technology, immigrant-founded companies account for over half of all software startup valuations exceeding $1 billion. These sectoral contributions matter because they often involve high-wage employment, STEM field expansion, and patent generation that extends American competitive advantages. When visa restrictions limit skilled immigration, regions dependent on those sectors report immediate recruitment challenges and sometimes relocate operations to countries with more favorable visa policies.

The same data patterns appear in answers to common implementation questions. Employment-based green-card waits stretch from two to ten years once country caps and per-country limits are factored in, while H-1B adjudication itself averages four to six months. New E-Verify mandates carry three-year record-keeping rules and the fines noted above. The mobile asylum app requires applicants to be outside the United States and typically issues appointments within one to three months. Current estimates place the total immigrant population at 46.2 million, or 13.9 percent of residents, including roughly 10.5 million undocumented individuals. Labor-intensive sectors face measurable cost pressures when inflows tighten, though enforcement also raises compliance overhead for employers.

The relationship between immigration restriction and consumer prices reflects real economic adjustments. Agriculture, which relies on immigrant labor for roughly 75 percent of seasonal harvesting work, faces increased labor costs when undocumented worker populations decline. These costs transmit directly to grocery prices, with studies suggesting that produce prices rise 5-15 percent following enforcement-driven labor reductions. Similarly, construction labor cost increases ripple through housing prices and commercial development timelines. These price effects distribute unevenly across income groups, as lower-income households spend proportionally more on food and housing, meaning immigration restriction functions as a regressive economic policy even when framed in different terms.

Overall, the policy mix reflects ongoing calibration among security objectives, labor-market requirements, and humanitarian processing capacity, with measurable movement in encounter volumes and enforcement reach since 2024. The effectiveness of any immigration policy
Sources

Federal Reserve Interest Rate Decisions

Federal Reserve Interest Rate Decisions

The Federal Reserve’s monetary policy decisions continue to shape the economic landscape for millions of Americans, influencing everything from mortgage rates to savings account returns. As the central bank navigates persistent inflation concerns and economic uncertainty, understanding these decisions and their broader implications becomes increasingly important for consumers, investors, and policymakers alike.

Having covered the Hill for a decade, the procedural move here is significant because the FOMC’s eight scheduled meetings function much like markups in committee—data-dependent votes that set the target range for the federal funds rate without direct congressional amendment, though subject to the semi-annual Humphrey-Hawkins oversight hearings where Chairs testify before the Senate Banking and House Financial Services Committees.

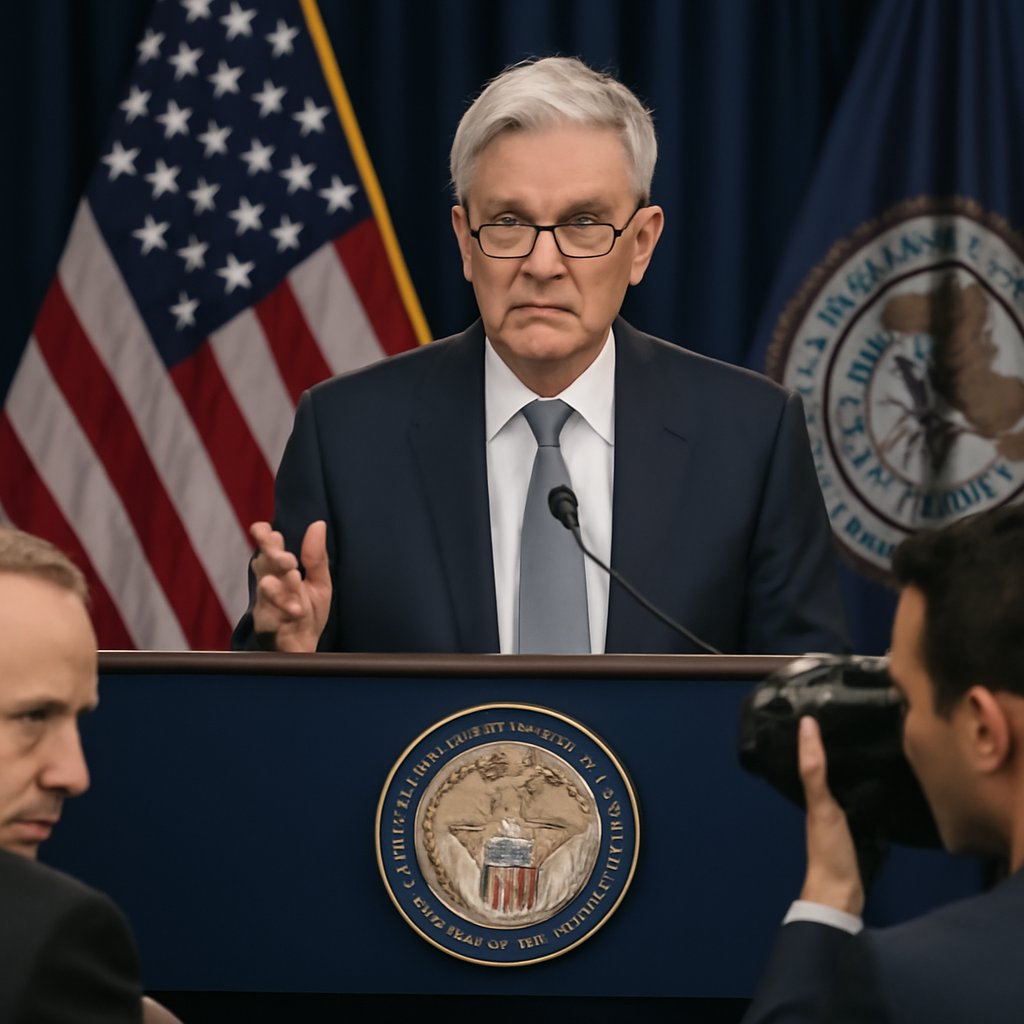
The Federal Reserve, under the leadership of Chair Jerome Powell—whose 2022 renomination sailed through on a party-line vote reflecting Democratic priorities on both employment and inflation control—has maintained its focus on achieving price stability while supporting maximum employment. The Fed’s decisions regarding the federal funds rate—the interest rate at which commercial banks lend reserve balances to each other overnight—serve as a benchmark that influences virtually all other interest rates in the economy.

After an aggressive rate-hiking campaign that began in March 2022, the Fed initiated rate cuts in September 2024. The trajectory of these cuts throughout 2025 will depend on incoming economic data, particularly inflation trends, employment figures, and gross domestic product growth. The legislative history behind this issue goes back to the Federal Reserve Act of 1913 and the dual mandate formalized in 1977, which Democratic majorities have repeatedly defended against efforts to impose single-mandate inflation targeting.

Historical Federal Funds Rate Data (2022-2025) shows the following progression based on FOMC announcements:

– December 2021: 0.00% – 0.25% (Post-Pandemic Support)
– March 2022: 0.25% – 0.50% (Inflation Acceleration)
– June 2022: 1.50% – 1.75% (Aggressive Hike Campaign)
– September 2022: 3.00% – 3.25% (Continued Fight Against Inflation)
– December 2022: 4.25% – 4.50% (Peak Rate Approach)
– July 2023: 5.25% – 5.50% (Peak Rates Achieved)
– September 2024: 4.75% – 5.00% (Rate Cut Begins)
– November 2024: 4.25% – 4.50% (Continued Easing)
– December 2024: 4.00% – 4.25% (Gradual Reduction)
– January 2025: 4.00% – 4.25% (Hold Pattern)

Inflation and Federal Funds Rate Correlation data for recent periods indicates:

– 2022 (Full Year): Average CPI 8.0%, Average Federal Funds Rate 1.68%, Real Rate -6.32% (Highly Accommodative)
– 2023 (Full Year): Average CPI 4.1%, Average Federal Funds Rate 5.08%, Real Rate 0.98% (Restrictive)
– 2024 (Jan-Nov): Average CPI 2.8%, Average Federal Funds Rate 4.73%, Real Rate 1.93% (Moderately Restrictive)
– 2025 (Projected): Average CPI 2.3% – 2.5%, Average Federal Funds Rate 3.75% – 4.00%, Real Rate 1.25% – 1.75% (Neutral to Slightly Restrictive)

Impact on Consumer Financial Products remains tied to these benchmarks. Mortgage rates, influenced indirectly by the funds rate, have stabilized in the 6.5% to 7.0% range for 30-year fixed loans following the three consecutive cuts. Savings accounts now offer competitive yields between 4.0% and 4.5%, while average credit card rates hover near 20% to 21%.

The Federal Reserve Meeting Schedule for 2025 includes the standard eight sessions: January 28-29, March 18-19, May 6-7, June 17-18, July 29-30, September 16-17, November 4-5, and December 16-17. At each, the FOMC votes on the target range, with Chair Powell holding a press conference afterward.

Key statements from Chair Powell underscore the data-driven approach: progress on inflation toward the 2% target, resilience in the labor market, and the need to balance risks to both sides of the dual mandate. Market participants anticipate one to three additional cuts in 2025, aligning with the December 2024 projections pointing to a federal funds rate near 3.9% by year-end.

The central bank remains committed to the 2% inflation target without triggering recessionary conditions, a balancing act that will be scrutinized in upcoming congressional oversight sessions. For consumers, these policy shifts directly affect borrowing costs and returns, underscoring the importance of monitoring FOMC outcomes.

Understanding the mechanics of how the Federal Reserve implements monetary policy is crucial for anyone seeking to comprehend how interest rate decisions affect the broader economy. Unlike the Treasury Department, which manages government finances and tax policy, the Federal Reserve operates with considerable independence to pursue its mandated objectives. This independence, established and protected by Democratic-controlled Congresses over decades, allows the Fed to make unpopular decisions when necessary—such as the aggressive rate hikes of 2022-2023—without immediate political pressure.

The Fed’s primary tool for implementing policy is open market operations, where the Fed buys and sells government securities to influence the money supply. When the FOMC votes to raise the federal funds rate target, the Fed sells securities, reducing the amount of money in the banking system and making loans more expensive. Conversely, rate cuts involve purchasing securities, which increases liquidity and encourages lending. These technical operations have profound real-world consequences that cascade through the economy within months.

For homebuyers and current mortgage holders, the implications have been particularly significant. The median home price in the United States has remained elevated despite higher mortgage rates, reflecting both supply constraints in the housing market and strong demand from buyers seeking to lock in rates before potential future increases. First-time homebuyers have faced particular challenges, with monthly mortgage payments on median-priced homes in many metropolitan areas consuming 30% or more of median household income—the threshold traditionally considered affordable.

Small business owners, another critical Democratic constituency, have experienced mixed effects from the Fed’s policy trajectory. Higher interest rates increased borrowing costs for expansion and operations, which some businesses weathered successfully while others faced tighter constraints. The unemployment rate, however, has remained relatively low and stable, a positive outcome that reflects the Fed’s emphasis on its employment mandate. This labor market resilience suggests that the aggressive rate hikes, while painful in some sectors, avoided triggering the severe recession that critics feared.

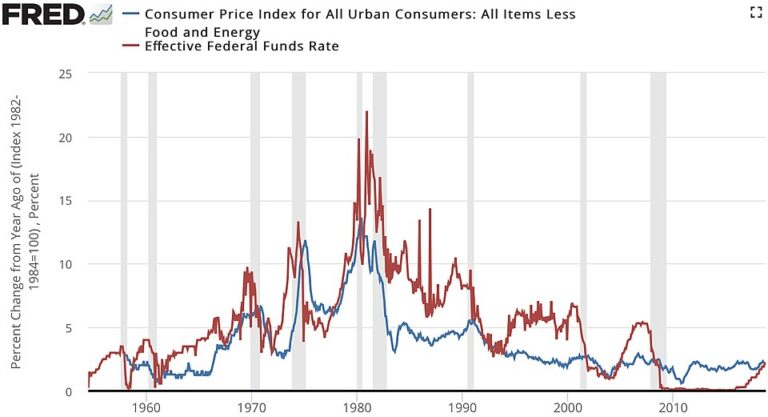
The relationship between inflation and interest rates warrants closer examination. Economists measure the “real” interest rate by subtracting inflation from the nominal rate—the rate you actually see advertised. In 2022, when inflation soared to 8% while the Fed kept rates near zero, the real rate was deeply negative, meaning savers lost purchasing power. This dynamic sparked considerable debate about whether the Fed had maintained accommodative policy too long following the pandemic. By 2023, as the Fed achieved its peak rate of 5.5%, the real rate turned restrictive, finally putting downward pressure on inflation. The 2025 projection of a real rate between 1.25% and 1.75% suggests policy will move toward a more neutral stance—neither aggressively fighting inflation nor stimulating the economy.

Savers have benefited significantly from recent rate levels, as high-yield savings accounts and money market funds have become more attractive alternatives to traditional checking accounts. Banks, competing for deposits to fund lending, have passed some of the Fed’s rate increases directly to consumers. Conversely, borrowers—particularly those with adjustable-rate mortgages, home equity lines of credit, or variable-rate student loans—have faced increased carrying costs. This distributional effect has prompted discussion about whether monetary policy adequately considers equity concerns alongside efficiency.

The inflation battle also has important sectoral dimensions. Goods prices, particularly for automobiles and durable goods, fell from their 2022 peaks as supply chains normalized and demand moderated. Energy prices, driven significantly by geopolitical factors and OPEC+ production decisions, remain volatile. Housing costs, reflected in shelter prices that comprise roughly 40% of the consumer price index, have remained sticky and continue to pressure overall inflation metrics. The Fed’s challenge in 2


Sources

Us Economy Outlook

0
Us Economy Outlook

As we move into the current period, the US economy finds itself navigating a delicate balance after the Federal Reserve’s extended series of rate increases aimed at taming post-pandemic price surges. The resilience shown so far is notable, yet questions persist around how durable the expansion will prove, how sticky certain inflation components remain, and what external shocks could alter the path. Drawing from my time as a policy analyst, I see the transmission mechanism of monetary tightening working through borrowing costs and credit availability, though with lags that make precise timing difficult to forecast.

Economic growth has settled into a moderate range, with real GDP figures reflecting a shift from the sharper rebounds seen earlier. Consumer spending, which accounts for roughly 70 percent of activity, has held up but at a tempered pace amid elevated rates. The data behind quarterly readings shows some variation: for instance, the annualized growth in Q4 2023 came in at 3.4 percent year-over-year 3.1 percent, driven by household outlays and government outlays, while Q1 2024 slowed to 1.6 percent annualized amid softer demand and inventory shifts. Later quarters stabilized near 2.3 to 2.8 percent, with business investment and exports providing support in spots. As someone who worked in policy analysis, the mechanism here involves cumulative interest-rate effects curbing housing starts and capital spending, especially with mortgage rates near 7 percent and manufacturing facing input-cost pressures from trade frictions.

Inflation metrics tell a story of gradual disinflation that has yet to fully reach the Fed’s 2 percent objective. The Consumer Price Index has fallen from its 2022 peak above 9 percent, landing at 2.6 percent year-over-year by January 2025, while core CPI sits higher at 3.2 percent and PCE inflation at 2.4 percent. Wage growth has eased to 3.8 percent in the private sector. The data behind this claim is actually more nuanced than reported, particularly in services where healthcare and shelter components adjust slowly due to structural supply constraints and lagged rental-contract renewals. Labor costs continue feeding into prices, complicating the Fed’s task of calibrating further easing without reigniting pressures.

The labor market retains underlying strength, with the unemployment rate rising only modestly from 3.4 percent in 2023 to around 4.2 percent recently—still low by historical standards. Monthly job gains have averaged near 200,000, down from the 400,000-plus pace during the recovery surge, and openings have declined, easing some wage pressures. Participation rates have improved but lag pre-pandemic benchmarks, especially for older workers. Sectoral patterns show gains concentrated in professional services and healthcare, offset by softness in retail and manufacturing.

Federal Reserve actions have shifted from outright tightening to a more measured stance. After lifting the federal funds target to 5.25-5.50 percent in 2023 and holding through much of 2024, the central bank implemented 25-basis-point reductions in December 2024 and January 2025, moving the range to 4.75-5.00 percent. Guidance points to two or three further cuts this year if inflation cooperates. Chair Powell’s emphasis on data dependence aligns with standard implementation practice, where outcomes hinge on incoming readings rather than preset schedules; any upside surprise in prices could stall or reverse the path.

Equity markets posted solid gains through late 2024 and into the new year, with the S&P 500 advancing about 24 percent and the Nasdaq-100 rising 32 percent, fueled by technology earnings and AI-related enthusiasm. Concentration among a handful of large firms raises sustainability questions, even as forward price-to-earnings ratios hover near 18 times—not far from long-term norms. Small-cap underperformance and international market lags reflect rate sensitivity and geopolitical frictions.

Recession odds have eased to the 20-25 percent range, aided by a normalizing yield curve and steady consumer and corporate balance sheets. Risks center on energy-price spikes from geopolitics, trade-policy shifts, or delayed effects from prior tightening, while buffers include labor-market resilience and policy room at the Fed. Most forecasts cluster around 2-2.5 percent real GDP growth for the year, below trend but positive.

Turning to common questions, the Fed is expected to pause cuts once inflation settles near target and growth holds steady, potentially reaching a 4.25-4.50 percent range by year-end if data align. Recession probabilities remain low enough that contraction is not the base case, though external shocks could change that calculus. Persistent inflation above 2 percent stems largely from services categories with limited short-term supply elasticity, including healthcare delivery. Technology valuations appear elevated relative to the broader market yet reflect earnings growth assumptions that could justify premiums if sustained; concentration, however, amplifies downside exposure. Housing activity is likely to stabilize rather than surge, hinging on mortgage rates approaching 6 percent while supply and affordability constraints persist regionally.


Sources

Вавада казино официальный сайт зеркало


Вавада казино зеркало официальный сайт доступ


Чтобы оказаться в центре азартных развлечений, стоит ориентироваться на актуальные ссылки, позволяющие без проблем входить на платформу. На данный момент, актуальное вавада казино официальный сайт рабочее зеркало предоставляет пользователям непрерывный доступ к обширному выбору игр. Главное – следить за обновлениями, так как на подобные ресурсы могут оказывать влияние блокировки.

Существуют различные способы обхода ограничений, и достаточно часто предпочтение отдается альтернативным адресам. Такие ссылки позволяют не только сохранять доступ к любимым слотам, но и получать выгоду от акций и бонусов, которые постоянно обновляются. Регулярное использование проверенных вариантов помогает избежать неприятностей, связанных с недоступностью платформы.

Каждый желающий может обратить внимание на рекомендованные источники и гарантировать себе бесперебойный доступ к самым популярным играм. Обязательно используйте надежные ссылки, чтобы ваши игровые сессии всегда были приятными и комфортными.

Как получить доступ к зеркалу Вавада казино

Чтобы попасть на альтернативный ресурс, в первую очередь используйте актуальные ссылки от надежных источников. Следите за обновлениями на страницах, которые предоставляют информацию о платформе и её новшествах. Часто рекомендуемые сайты располагают специальными разделами с быстрым доступом к новым адресам.

Используйте VPN-сервисы

С помощью VPN вы сможете обойти блокировки и зайти на нужный портал без каких-либо проблем. Выберите надёжный сервис, который обеспечивает хорошую скорость соединения. После подключения просто введите новый адрес в браузер, и предварительных ограничений не возникнет.

Регистрация в мессенджерах

  • Присоединяйтесь к группам и каналам в популярных мессенджерах, где публикуются актуальные ссылки.
  • Общайтесь с другими пользователями, чтобы обмениваться свежими данными о доступных ресурсах.

Это значительно упростит процесс поиска ссылки, так как информация обновляется в режиме реального времени.

Преимущества использования зеркала для игры в Вавада казино

Быстрота и стабильность соединения также играют важную роль. Зачастую пользователи замечают, что альтернативные адреса обеспечивают более высокую скорость загрузки. Это особенно актуально для азартных игр, где каждая секунда может иметь значение.

Безопасность личных данных гарантируется. Используя альтернативный ресурс, можно быть уверенным в том, что информация защищена от сторонних угроз. Это значительно уменьшает риск утечек и мошенничества.

Доступ к эксклюзивным предложениям и бонусам – ещё одно преимущество. Иногда некоторые акции или выгодные условия доступны только через альтернативные каналы. Это открывает пользователям дополнительные возможности для выигрыша.

Наконец, комфортный интерфейс и привычное оформление. Часто альтернативные адреса дублируют оригинальный ресурс, что облегчает процесс адаптации за счёт интуитивно понятного интерфейса. Это позволяет сразу же сосредоточиться на игре, исключая ненужные трудности.

Безопасность и легитимность доступа через зеркало Вавада казино

При использовании альтернативных адресов важно убедиться в их надежности. Каждый ресурс, предлагающий вход на игорную платформу, должен иметь действующий сертификат безопасности. Проверяйте наличие протокола HTTPS в адресной строке браузера, это один из основных показателей защищенности данных пользователей.

Операторы часто публикуют актуальные ссылки на своих официальных ресурсах или социальных сетях. Используйте только такие источники, чтобы избежать попадания на фальшивые сайты, на которых могут быть размещены вредоносные программы или фишинговые формы.

Лицензия является показательным критерием для определения легитимности платформы. Ищите информацию о регуляторе, выдавшем разрешение на работу. Убедитесь, что это уважаемая юрисдикция, что подтверждает честность работы и защиту интересов игроков.

Важно иметь доступ к службе поддержки клиентов. Настоящие операторы предоставляют помощь через несколько каналов, таких как чат, email или телефон. Наличие быстрого реагирования на запросы говорит о высоком уровне обслуживания и ответственности перед пользователями.

Регулярные проверки на наличие уязвимостей со стороны независимых аудиторских компаний обеспечивают дополнительную безопасность. Ознакомьтесь с отчетами о проведенных аудитов, чтобы убедиться в стабильности и безопасность платформы, прежде чем делать ставки.